⭐ Quick Summary
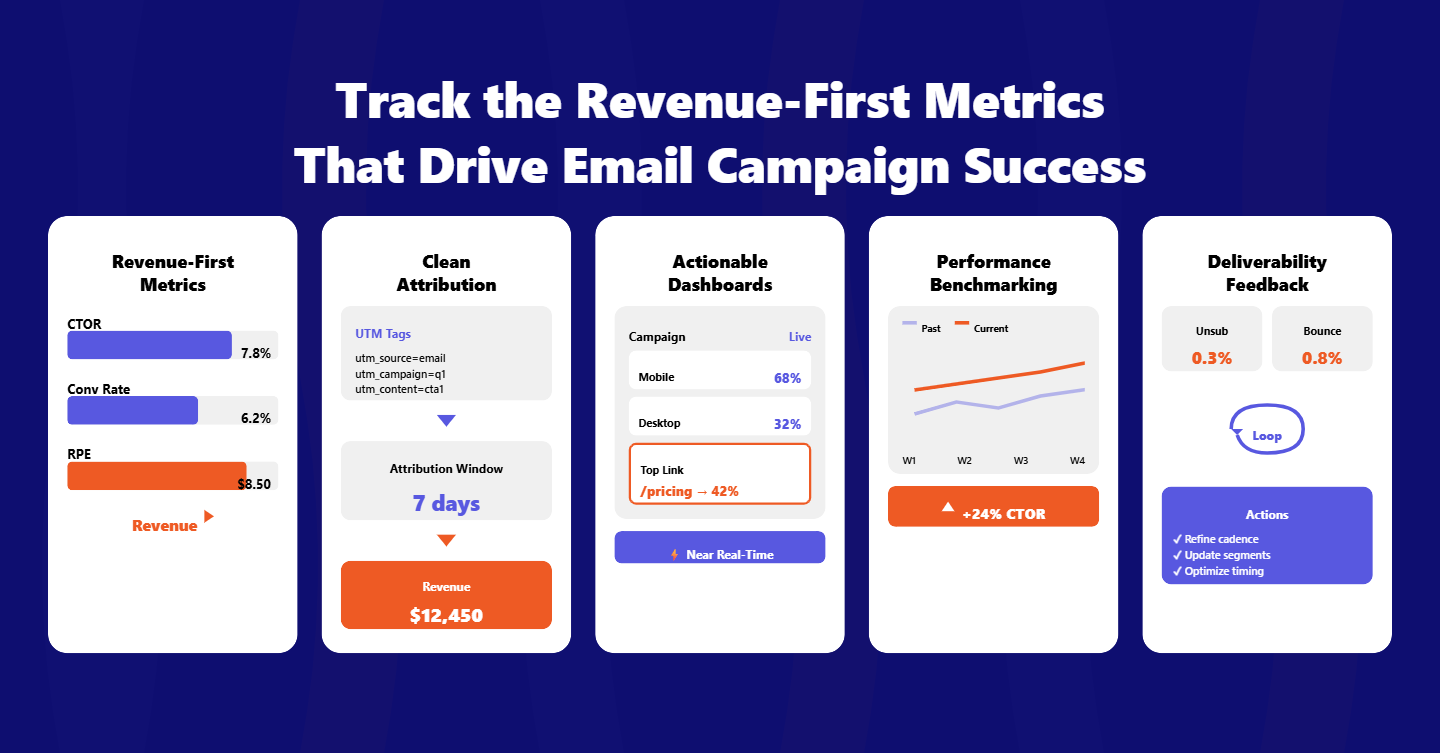
💰 Revenue-first metrics: Focusing on revenue-first email campaign performance metrics like CTOR, conversion rate, and RPE outperforms chasing opens, aligning your reporting with outcomes that compound growth and improve customer experience.
🔗 Clean attribution: Standardized UTMs, link-wrapped click tracking, and a clear attribution window prevent double-counting, enabling trustworthy email campaign reports and consistent revenue attribution across devices and sessions.
📊 Actionable dashboards: An actionable email analytics dashboard highlights link-level performance, device and geo context, and near real-time updates, turning insights into timely optimizations that protect revenue during critical promotions.
📈 Performance benchmarking: Benchmark against your own past performance by segment and campaign type, and make weekly and monthly reports a habit to uncover trends, seasonality, and repeatable plays that elevate RPE.
🛡️ Deliverability feedback loops: Use unsubscribe, bounce, and complaint data to refine cadence, segmentation, and deliverability, while treating opens cautiously due to privacy changes and prioritizing clicks, conversions, and revenue in decisions.
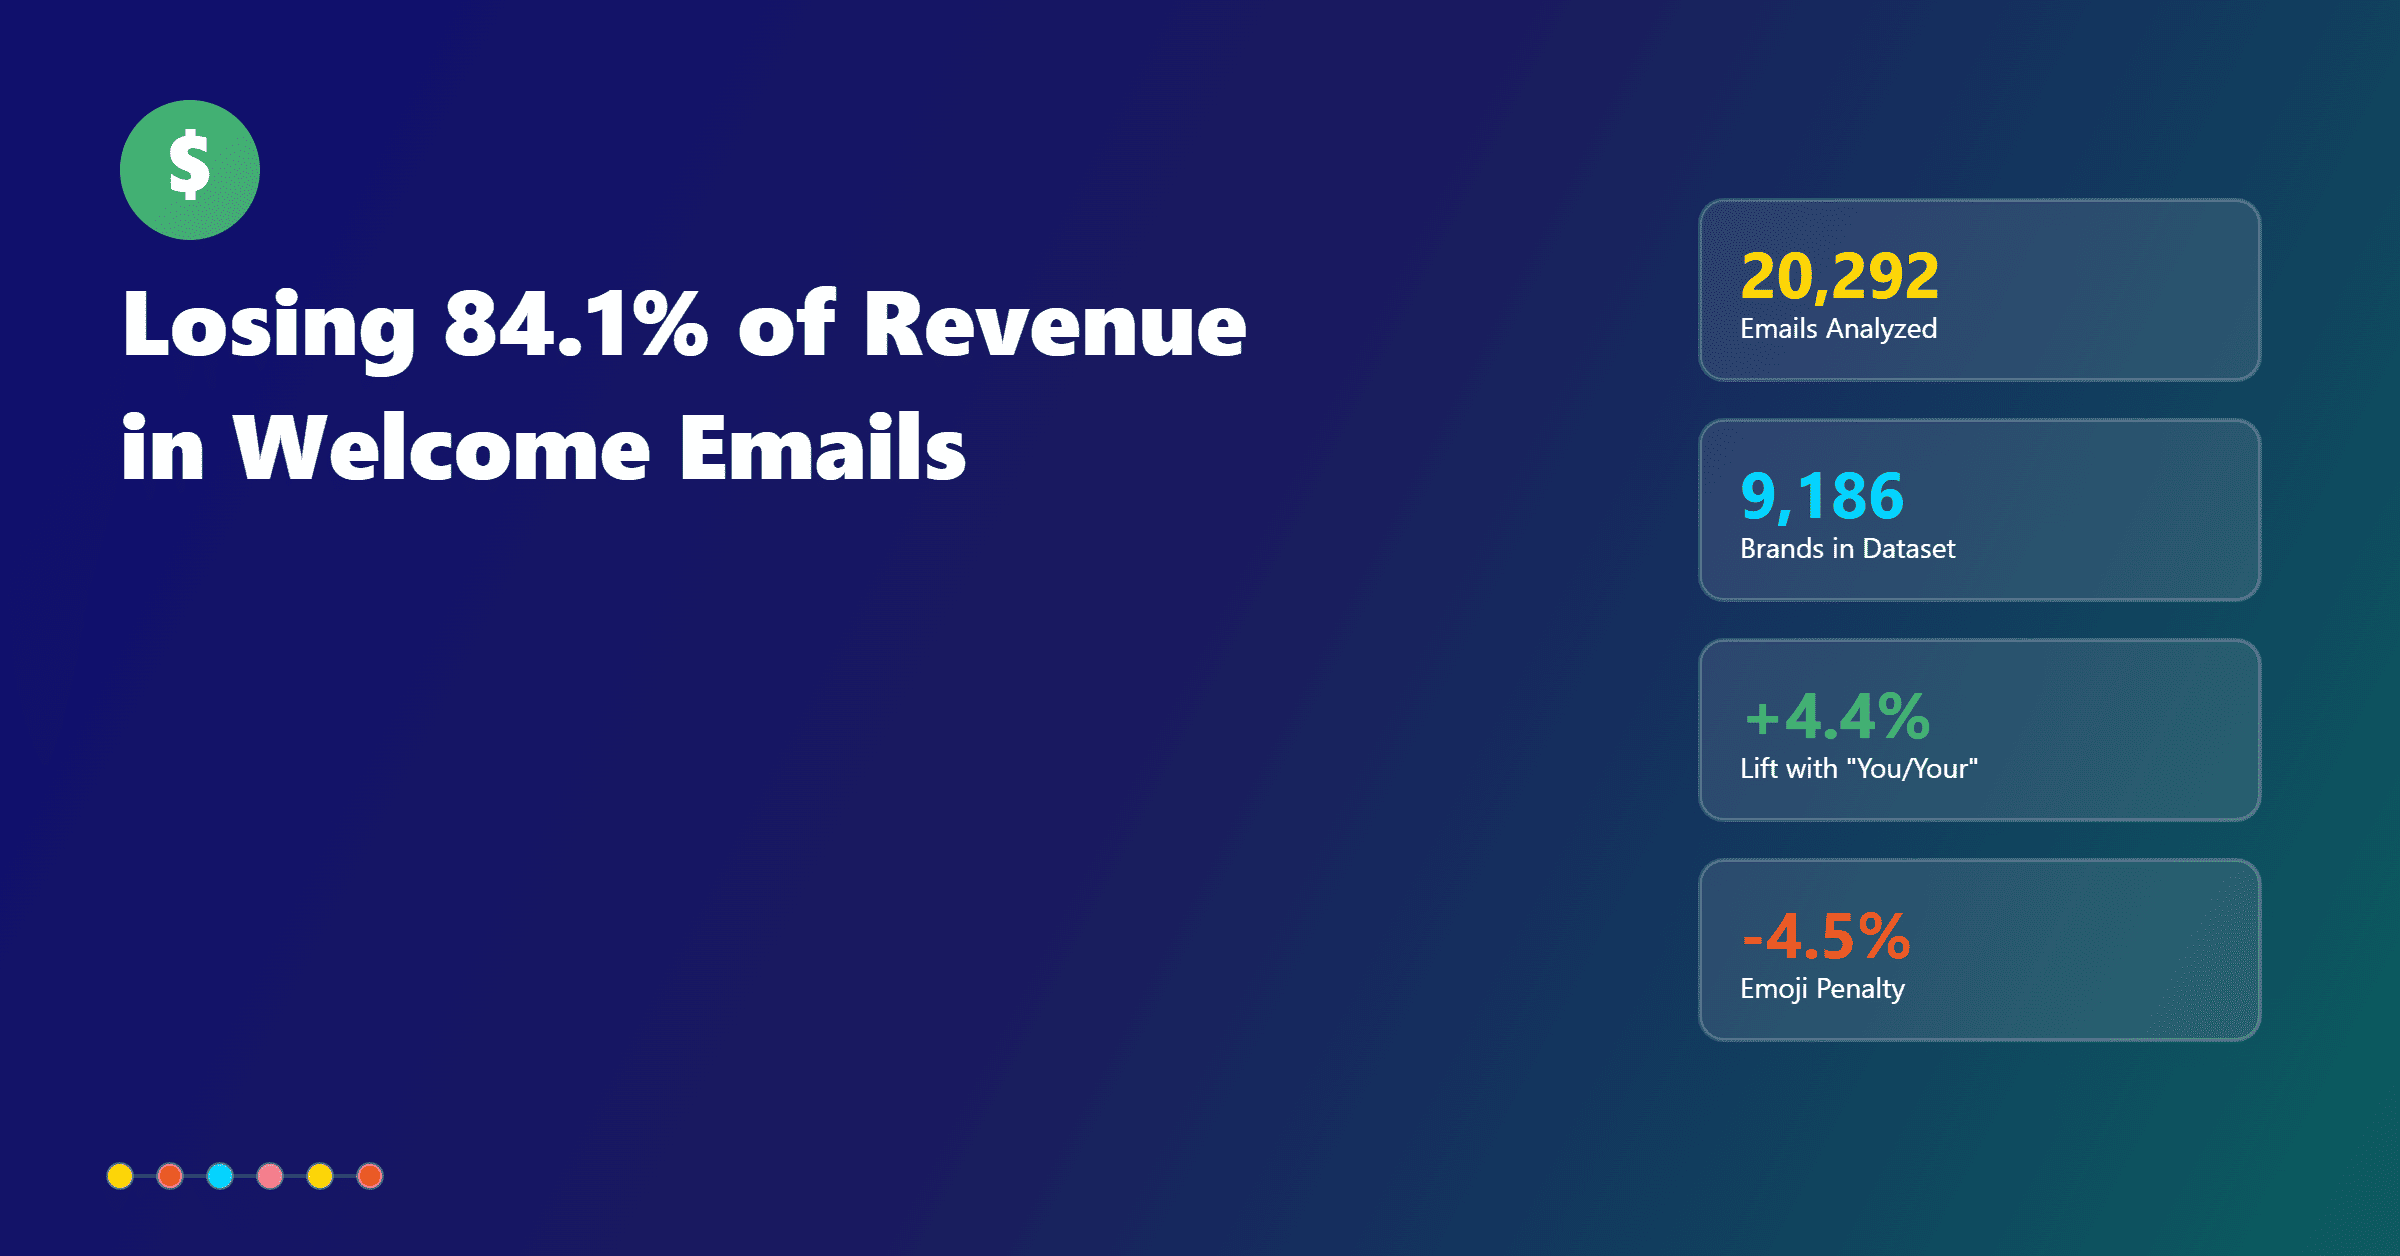
Email opens don’t pay the bills. Revenue does.
If you can’t connect your campaigns to dollars, you’re flying blind and optimizing for the wrong outcomes.
E-commerce teams need to focus on email campaign performance metrics that prove ROI, spotlight what content actually converts, and expose what’s wasting send volume and list health.
This guide shows how to separate vanity from value, which email analytics metrics to trust, and how to build an email analytics dashboard that fuels decisions.
You’ll walk away with an actionable framework, practical benchmarks, and reporting habits that compound revenue over time.
Define the Must-Track Email Campaign Performance Metrics
Core counts that keep you honest
Every reliable analytics program starts with the raw numbers.
Track sends, deliveries, bounces, unsubscribes, unique opens, total opens, unique clicks, and total clicks.
Unique counts show how many individual recipients took an action, while total counts reveal cumulative behavior across repeat actions.
This distinction matters when evaluating stickiness, repeat interest, and whether a small set of highly engaged customers is skewing your perception of performance.
Derived rates that standardize performance
Rates turn raw counts into apples-to-apples comparisons across campaigns and segments.
Open rate estimates audience interest in your subject line and brand, but should be treated cautiously due to mailbox privacy features.
Click rate measures the percentage of delivered emails that earned at least one click, indicating overall funnel momentum.
Click-to-open rate (CTOR) isolates how compelling your content and calls to action were for people who actually opened.
Bounce rate highlights deliverability risks, and unsubscribe rate warns you when cadence, relevance, or list hygiene needs adjustment.
Revenue KPIs that prove ROI
For e-commerce, your most important email performance metrics are revenue-focused.
Track conversion rate to see what percentage of clickers purchased.
Pair that with revenue, revenue per email (RPE or EPC), and average order value (AOV) to quantify the dollars tied to each send.
RPE is the single best roll-up metric for campaign success because it blends engagement and monetization into one number that maps cleanly to business outcomes.
The KPIs That Matter for E‑Commerce ROI
CTOR versus CTR and when to use each
Use CTOR to judge the quality of your creative, merchandising, and CTA hierarchy among people who opened.
It filters out deliverability and subject-line noise, letting you focus on content resonance.
Use click-through rate (CTR) to measure top-to-bottom campaign impact across your entire delivered audience, especially when comparing different audiences, segments, or sends with varying deliverability and timing.
Conversion rate and RPE as north stars
Conversion rate shows how well your traffic converts, but RPE shows how well your entire email turned into revenue.
RPE accounts for open rates, click rates, conversion rates, and order value in one revenue-first KPI for email marketing.
When RPE rises, you’re making more per send and compounding revenue without necessarily increasing volume or frequency.
Health metrics for sustainable growth
List growth and churn determine tomorrow’s reach. Track net new subscribers, unsubscribes, and spam complaints to understand how acquisition and retention balance out.
Repeat purchase rate adds an LTV lens, revealing whether your emails are driving one-time orders or building loyal customers.
If you run a loyalty program, tying repeat purchases to segments and rewards activity can uncover highly profitable cohorts.
Make Your Email Analytics Dashboard Actionable
Link-level insight that surfaces what converts
Link-level click analytics transform your email campaign metrics into merchandising insight.
Identify the top-clicked links and link clusters by position, creative type, or product category to see what prompts action.
This clarity moves decisions from taste to data, guiding creative iterations and future product placement.
An effective email analytics dashboard highlights top links, top sections, and click distribution across the message so you can reallocate space to what sells.
Device, client, and geo breakdowns
Design and deliverability depend on context. Device and email client breakdowns reveal whether mobile rendering, dark mode, or client-specific quirks (like Gmail clipping) are hurting CTOR.
Geographic insights help you time regional sends, localize promotions, and understand time zone behavior that might affect open and click patterns.
Segmenting results by device, client, and region makes creative testing more precise and your email campaign reporting metrics more actionable.
Date range filters and near real-time updates
Speed matters when a big promotion is live. Your analytics should update within minutes, not hours, and allow flexible date ranges to compare pre-, during-, and post-campaign behavior.
With near real-time analytics, you can catch a broken link, adjust a hero placement, or throttle a resend before you burn through opportunity.
Consistent definitions across your email campaign reports ensure that comparisons week over week always mean the same thing.
Benchmarking and Reporting Cadence
Practical benchmarks and how to use them
Public email marketing performance benchmarks are helpful, but they vary widely by vertical, product price point, and list maturity. Treat them as guardrails.
Because open rates are inflated by Apple Mail Privacy Protection, focus on CTOR, conversion rate, RPE, and unsubscribe rate for truer comparisons.
Create internal benchmarks by segment, campaign type, and season, so you are competing with your own best performance under similar conditions.
Weekly and monthly reporting that compounds learning
A consistent reporting cadence turns data into traction.
Weekly email campaign reports help you spot fast-moving issues like deliverability dips, creative misses, or high unsubscribe pockets.
Monthly reporting reveals seasonal trends, cohort performance, and the cumulative effect of segmentation strategies.
Tie every report back to a small list of email marketing performance metrics you will improve next cycle, and carry forward those learnings in a living playbook your whole team can use.
Accurate Revenue Attribution
UTM standards and naming conventions
Revenue attribution starts with rigor. Standardize UTMs across all campaign links so analytics systems consistently bucket traffic and conversions.
A clear naming convention for source, medium, campaign, content, and term allows efficient filtering in your analytics tools and keeps your email campaign reporting metrics consistent across teams and time.
Click tracking and attribution windows
Clicks should be tracked via link wrapping and redirection so you can measure unique and total clicks reliably.
Define a post-click attribution window that fits your buying cycle, often three to seven days for e-commerce, and document it so stakeholders interpret reports correctly.
Make sure your email analytics metrics deduct or adjust for returns, cancellations, and partial refunds to keep revenue figures trustworthy.
Avoiding double-counting and handling post-purchase events
If your customers browse on mobile but purchase on desktop, consider how cross-device identity impacts attribution.
Choose a last-click, first-click, or position-based model and stick with it.
Prevent double-counting when a customer clicks multiple emails by applying clear precedence rules and reconciling post-purchase events back to the correct campaign and date.
Optimize With Insights, Not Guesses
Use subject lines as a proxy, not a promise
Treat open rate as a directional signal rather than a definitive metric due to privacy changes.
Test subject lines and preheaders to earn attention, but judge their success by downstream CTOR, conversion, and RPE, not opens alone.
Where possible, complement global results with holdout tests to measure true incremental lift.
Creative and CTA choices tied to CTOR
CTOR is your best measure of in-email storytelling.
Improve CTOR by clarifying hierarchy, tightening copy, surfacing social proof, and placing primary CTAs above the fold.
Image compression, button contrast, and clear value propositions often yield fast wins that show up immediately in your email marketing performance metrics.
Send time, frequency, and cadence driven by subscriber feedback
Unsubscribe and complaint rates tell you when your cadence is too aggressive or your targeting misses.
Adjust send times by device behavior and geographic distribution to meet subscribers when they are most receptive.
Segment by lifecycle stage, purchase history, and engagement so frequency aligns with intent, not guesswork.
Deliverability fixes rooted in bounce and complaint data
Monitor hard and soft bounces to protect the sender’s reputation.
Remove invalid addresses quickly, warm new IPs gradually, and isolate inactive subscribers before they damage deliverability.
Improvements here compound across every future send and will be reflected in healthier engagement and revenue.
Avoid Common Analytics Pitfalls
Apple MPP and inflated opens
Apple MPP preloads tracking pixels, inflating open rates and distorting any open-based segment.
Prioritize clicks, conversions, and RPE in your email marketing performance metrics, and use CTOR as your creative barometer since it depends on opens and clicks together.
Bot clicks and security scanners
Some clicks are not human. Look for patterns like zero dwell time, uniform user agents, or pre-send clicks. You may also exclude email bot clicks from your email campaigns using your email platform settings.
Use click validation, delayed redirects, and anomaly filtering in your analytics to keep your email campaign metrics clean.
Gmail clipping and message weight
Long or heavy emails can be clipped, hiding CTAs and the unsubscribe link.
Keep HTML lean, compress images, and place critical content early to protect CTOR and reduce accidental spam complaints.
Privacy changes and consistent definitions
Document how you calculate unique versus total metrics, how you treat multi-click sessions, and which attribution model you use.
Consistency across systems and time periods makes your email analytics dashboard trustworthy and your decisions defensible.
Export and Share Findings
CSV exports for deep analysis and collaboration
Your team should be able to export clean CSVs for ad hoc analysis, pivots, and blending with sales data.
When analysts and marketers work from the same structured dataset, insights move faster, and rework disappears.
Visual charts and stakeholder-ready snapshots
Executives do not need raw rows; they need clear trend lines and a narrative.
Use charts for CTOR, conversion rate, RPE, and unsubscribe rate across comparable periods, and annotate shifts with the specific creative or targeting change that drove them.
A crisp snapshot accelerates decisions and keeps everyone aligned on the KPIs that matter.
Conclusion
You don’t need more data; you need the right data in the right context.
When your email campaign performance metrics prioritize CTOR, conversion, and RPE, every creative decision, segmentation choice, and send becomes measurably smarter.
An actionable email analytics dashboard with link-level clarity, device and geo context, and near real-time updates turns reporting from a chore into a growth engine.
If you want this discipline built in, TargetBay Email & SMS gives eCommerce brands a revenue-first analytics stack, from link-level click tracking and consistent UTMs to conversion and RPE reporting, all updated within minutes.
Pair it with its AI email agent for faster launches and use integrated revenue attribution to finally connect every send to sales with confidence.