⭐ Quick Summary
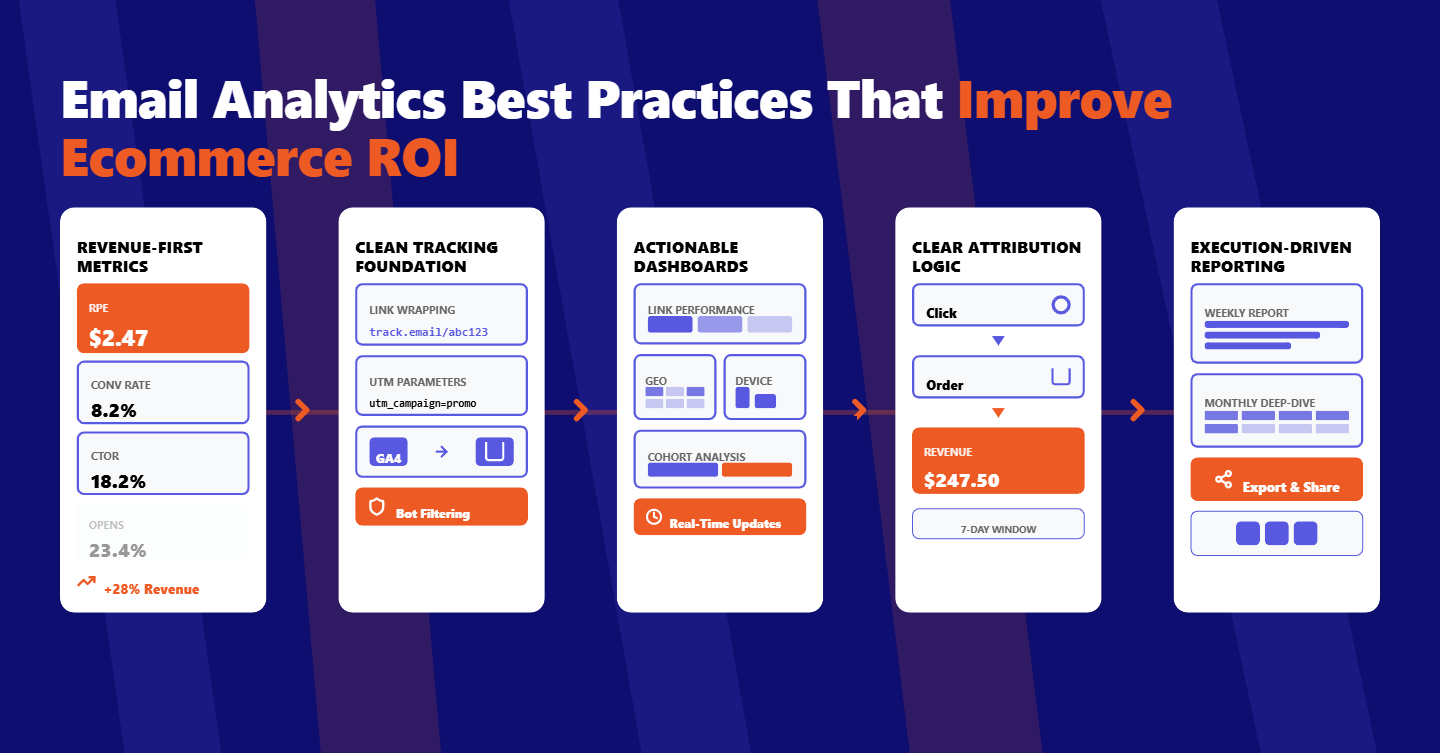
💰 Revenue-over-vanity metrics: Strong programs replace vanity metrics with revenue per send, conversion rate, CTOR, and unsubscribe and bounce rates, establishing transparent definitions for unique versus total counts and an accuracy standard everyone trusts.
🔗 Trustworthy tracking foundations: Reliable tracking relies on link wrapping, rigorous UTM tagging, GA4 alignment, ecommerce integration, and bot filtering, with open pixels treated cautiously given Mail Privacy Protection and other evolving privacy controls.
📊 Scalable, real-time dashboards: Dashboards must deliver near real-time, secure, and scalable insights, highlighting link-level clicks, geo, device, client breakdowns, cohort comparisons, and sensible benchmarks that reflect your audience and seasonality.
🧭 Clear attribution rules: Attribution should be click-based with clear lookback windows, multi-touch rules when necessary, and margin-aware reporting using revenue per recipient, revenue per click, and revenue per email to guide investment decisions.
⚙️ Reporting that drives action: Consistent reporting rhythms, from weekly executive summaries to monthly deep-dives, turn data into action, while tools like TargetBay Email & SMS make campaign analytics, revenue attribution, and shareable reporting effortless.
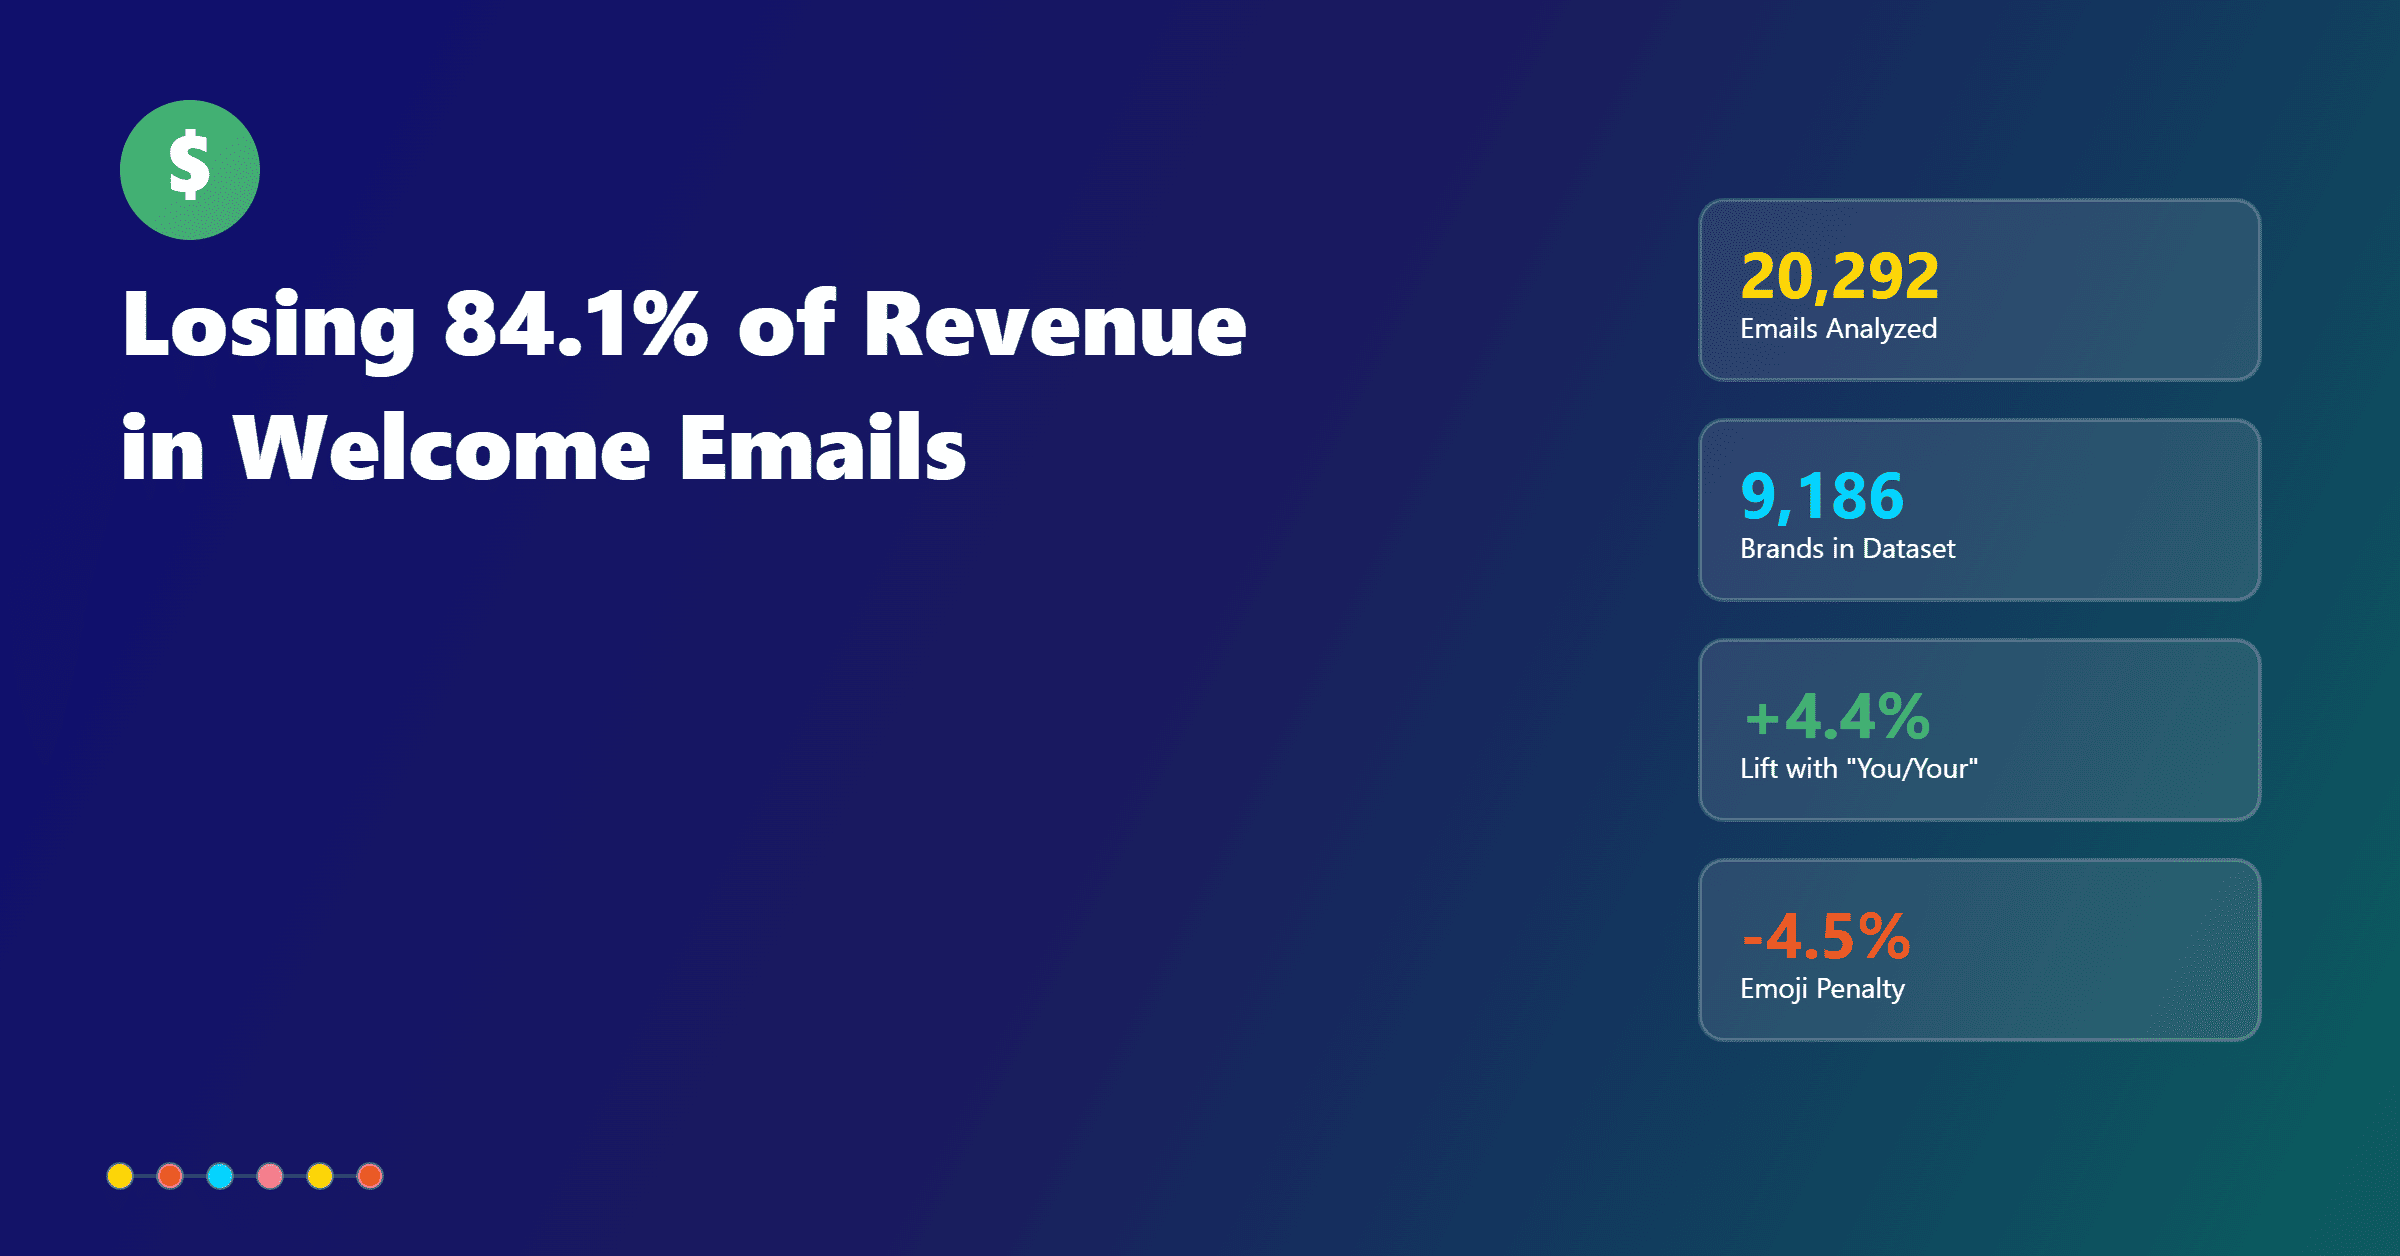
Open rates won’t pay your bills. But revenue per send does.
The best email programs connect every click to cash and turn insights into repeatable growth.
These email analytics best practices show e-commerce teams exactly what to track, how to track it, and how to report results with confidence.
Ecommerce brands don’t need more charts.
They need reliable attribution, clean benchmarks, and executive-ready summaries that spotlight what moved revenue and what to try next. Consider this your practical blueprint.
Define Success Beyond Vanity Metrics
Serious growth starts with a KPI set built for revenue, not applause. Revenue per send ties performance directly to commercial impact by dividing attributed revenue by delivered emails.
Conversion rate shows how many recipients bought after clicking.
Average order value illuminates merchandising effectiveness, while revenue per recipient blends conversion and order value into one powerful view.
Click-through rate and click-to-open rate reveal the quality of traffic your email generates.
CTR measures the percent of delivered recipients who clicked, while CTOR isolates the percent of openers who clicked.
Both matter, but CTOR often better reflects subject line, preheader, and content alignment with intent.
Bounce and unsubscribe rates measure list health and content relevance.
Bounces should be monitored as hard and soft separately to detect reputation or data hygiene issues early.
Unsubscribes tell you when you are oversending, under-segmenting, or misaligned on offers.
Know your methodology for unique versus total reporting.
A unique open or click counts a person once, no matter how many times they act, while totals count every instance.
Use unique numbers to track engagement and totals to understand intensity.
Always declare which one your team uses in dashboards and reports to avoid misinterpretation.
Set accuracy standards to build trust. Aim for a 0.1% tolerance between high-level and exported metrics, reconcile rounding at the segment level, and document edge cases such as delayed conversions, refunds, and multi-device interactions.
Treat this rigor as a discipline, not a nice-to-have.
Build Reliable Tracking Foundations
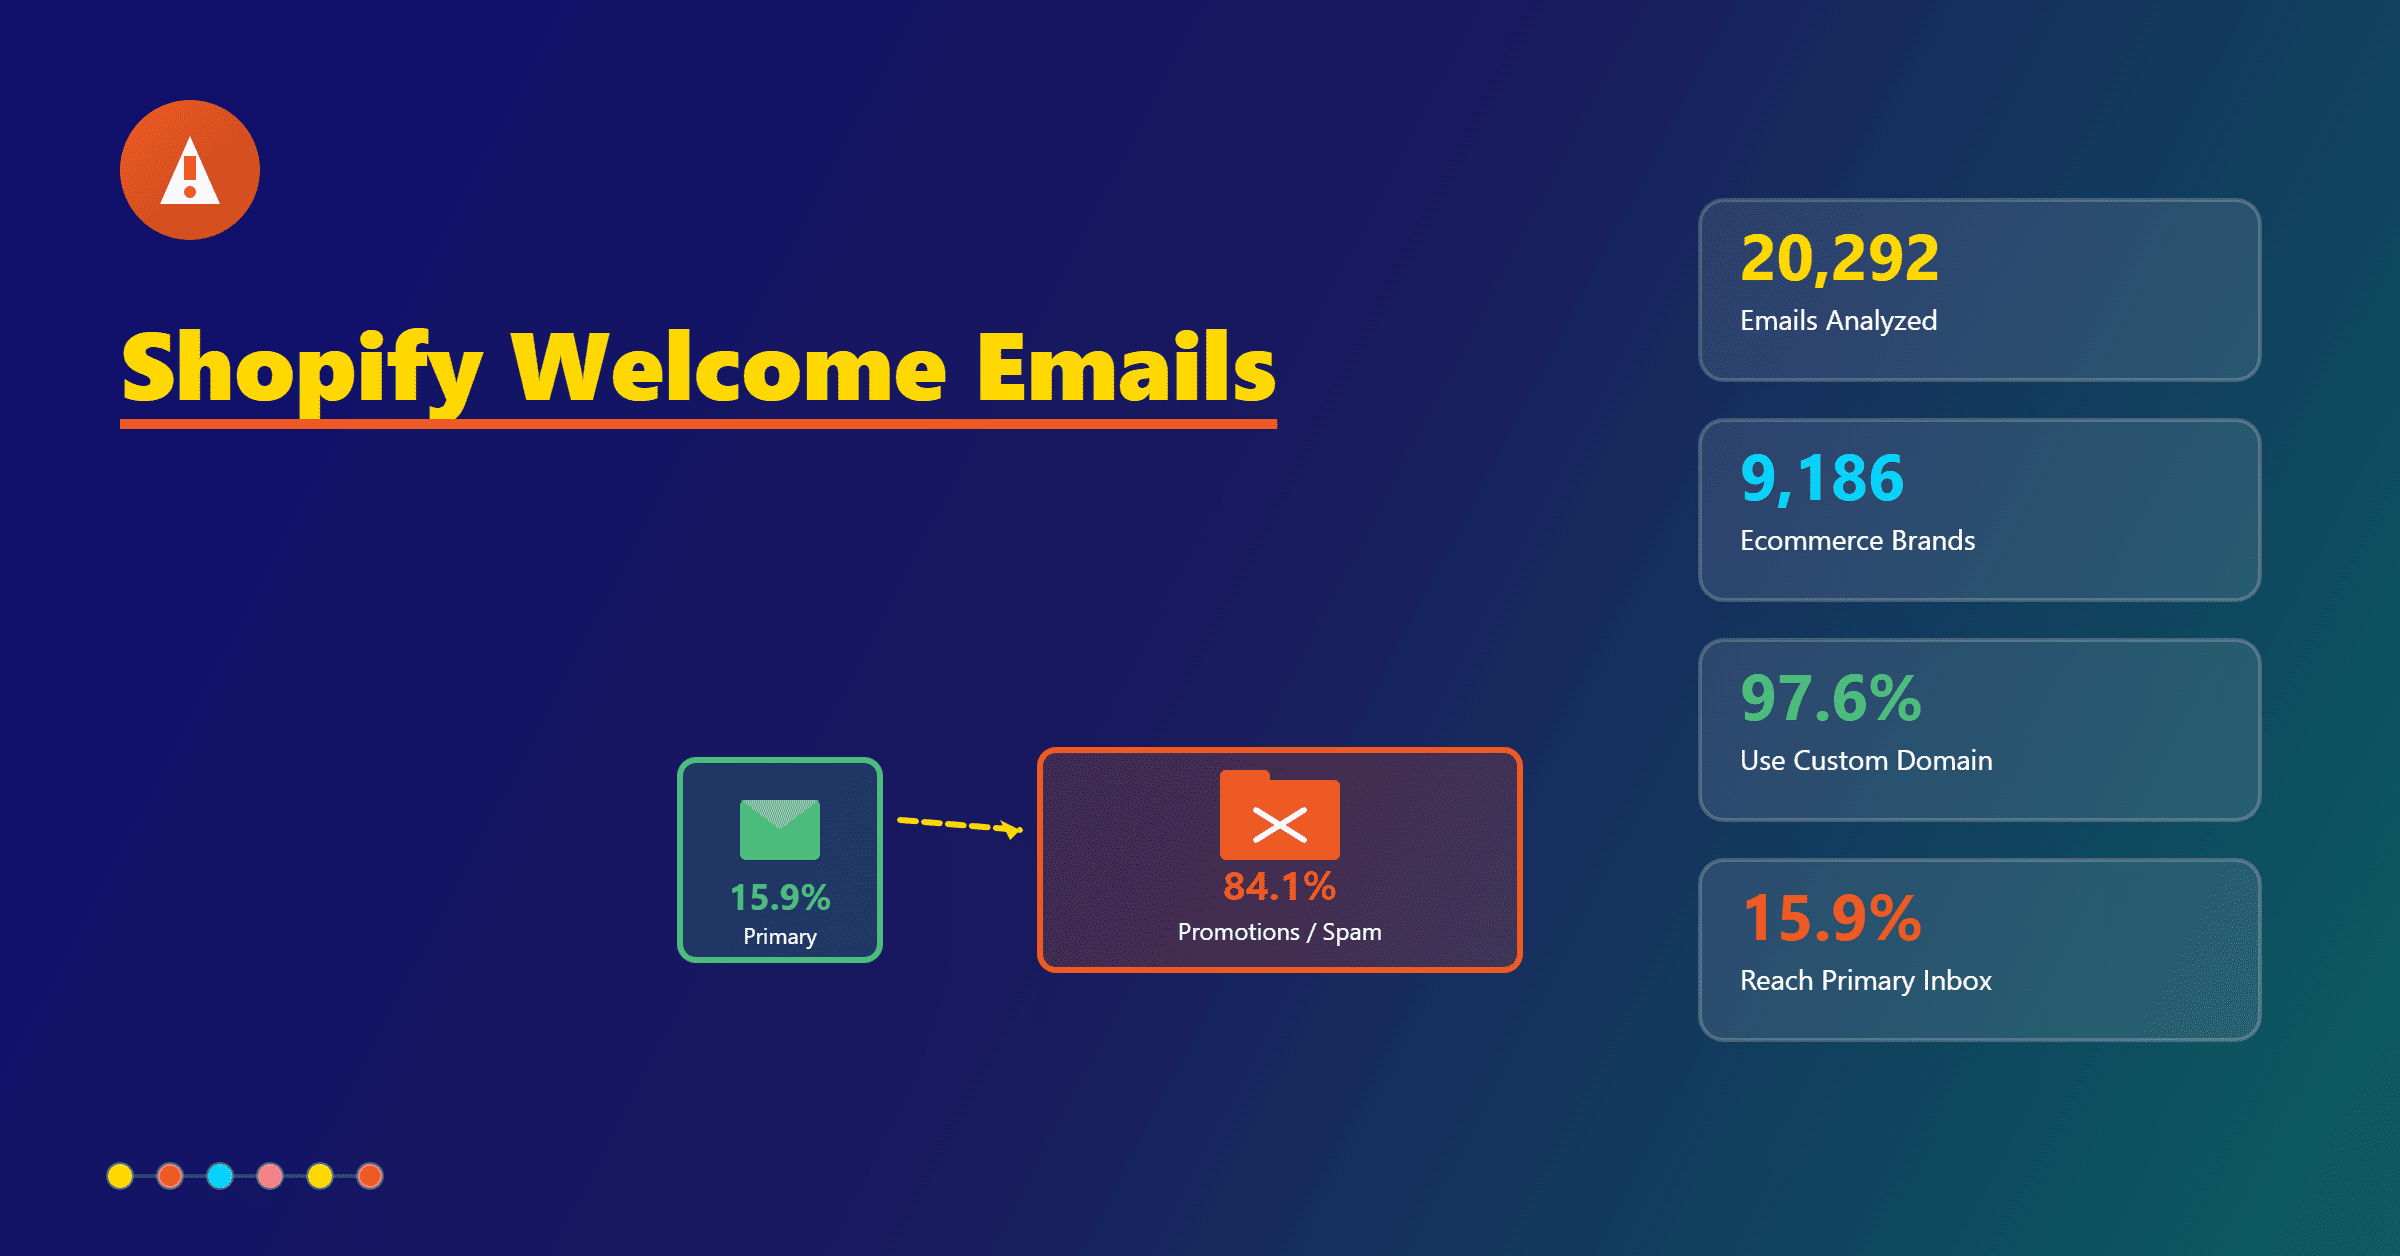
Email opens are tracked via a pixel and are now heavily influenced by privacy protections like Apple’s Mail Privacy Protection.
Treat open rates as directional, not definitive. Use them mainly for trend lines and to gauge relative engagement among similar audiences.
Clicks must be tracked with link wrapping and redirection so every link carries identity and campaign context.
Standardize UTM tagging for all promotional, automated, and transactional emails.
Enforce a canonical naming scheme for source, medium, campaign, content, and term so attribution in your analytics platform is consistent.
Align UTMs to your GA4 events and parameters so sessions and conversion events tie back to campaigns correctly.
Audit URL casing and whitespace issues, and capture product-level IDs in URLs when possible to enable revenue attribution at the SKU level.
Connect your ecommerce platform so order IDs, revenue, and margins flow back to your email analytics.
Attribute revenue primarily to last identifiable click from email within a defined lookback window.
Filter obvious bots using user agent flags, impossible click velocities, and no-referrer behaviors.
Treat inbox rendering services and security scanners separately to avoid stripping out legitimate human clicks.
Respect consent and data hygiene end-to-end.
Verify collection practices, prune invalid addresses, and suppress chronic non-openers tactically.
Clean inputs produce clean outputs, and consent drives deliverability, which directly affects your revenue data.
Dashboard Essentials
A useful dashboard gives you a single source of truth and updates in near real-time, ideally within minutes.
Start with an overview panel that surfaces sends, deliveries, opens, clicks, unsubscribes, bounces, revenue, and derived rates like open rate, click rate, CTOR, bounce rate, and unsubscribe rate.
Link-level analytics are non-negotiable. See which URLs, CTAs, and placements are driving the most clicks and revenue.
Break out performance by geo, device, and email client to optimize creative and test mobile-first variants where necessary.
Date-range filters and campaign cohorts let you compare launches, holidays, and lifecycle flows.
Segment by lifecycle stage, acquisition source, or product category to surface patterns hidden in the averages.
Benchmarks offer context; compare against your trailing 30-day or 90-day averages and seasonal norms rather than generic open rate benchmarks that ignore your audience and offer mix.
Performance matters as much as completeness. Executive dashboards should load in seconds, support exports to CSV, and be secure for authorized users only.
At scale, look for dashboards that can handle millions of recipients without timing out or sampling data.
Analyze What Moves Revenue
Find top-clicked links and study their context. The same CTA copy can perform differently depending on placement, image adjacency, and urgency signals.
Heatmaps and scroll-depth equivalents help translate raw clicks into real content guidance.
Run offer and content tests with clear hypotheses.
A discount versus value-stack comparison, or a collection landing page versus a product detail page, can shift AOV or conversion rate dramatically.
Keep tests mutually exclusive and long enough to reach confidence while balancing list fatigue.
Optimize send time and frequency with proof, not hunches.
Analyze period-over-period performance by weekday and hour across segments.
Some shoppers convert on weekday evenings while others buy during weekend downtime. Let your data dictate the calendar and your throttle.
Work in trends, not one-offs. Track rolling averages for revenue per send, CTOR, and unsubscribe rate.
Flag inflections early and investigate creative, audience, and deliverability simultaneously to avoid single-variable thinking.
Attribution That Stands Up
Click-based attribution remains the most reliable model for email.
Define a default lookback window that fits your buying cycle, such as three to seven days for mid-ticket retail and longer for high-consideration items.
For campaigns that precede major promotions, allow a broader window while documenting the rationale.
Handle multiple touchpoints with rules. When a subscriber clicks multiple emails before buying, determine whether last click wins or whether an assist model applies.
Consider multi-touch credit for lifecycle flows that nurture intent and promotional blasts that close the deal, but keep the framework simple enough to explain in one sentence.
Focus on revenue per recipient, revenue per click, and revenue per email as complementary measures.
Revenue per recipient reflects list quality. Revenue per click reveals landing page and offer quality.
Revenue per email helps you prioritize creative and segments with predictable upside.
Make your reporting margin-aware where possible. Topline revenue can hide loss-making promotions once cost of goods, discounts, shipping, and returns enter the picture.
Adjust for refunds and cancellations to keep everyone honest and to protect long-term profitability.
Deliverability and List Health
Analytics are only as good as inbox placement.
Monitor bounce rate, complaint rate, and spam folder indicators as leading signals.
Segment by acquisition source to identify risky cohorts and use warming and throttling strategies for new IPs and domains.
List cleaning should be routine, not reactive. Remove hard bounces immediately and suppress chronic non-responders after a reasonable re-engagement attempt.
A sunset policy protects the sender’s reputation and keeps your metrics believable.
Re-engagement criteria should include behavioral triggers, preference updates, and explicit win-back offers.
Track the revenue lift from reactivated subscribers and compare it to the cost of continued mailing to low-intent segments.
Every deliverability improvement compounds your analytics fidelity.
Better inboxing yields more human opens and clicks, clearer CTOR trends, and more consistent revenue attribution across devices and clients.
Platform-Specific Tips, Tool-Agnostic
Most email platforms let you set default UTMs at the account or campaign level.
Standardize those defaults and enforce link-level overrides only when a unique identifier adds value.
Keep campaign names human-legible and machine-friendly to simplify analysis across tools.
Export CSVs at the campaign and link level on a regular cadence.
Join these files with ecommerce order exports using campaign IDs, subscriber IDs, or click IDs. Maintain a data dictionary that explains every column, including whether a metric is unique or total, and how it is calculated.
In your analytics platform, build a view that isolates email as a source and medium with consistent casing.
Validate that sessions and purchases from your email traffic align with your internal campaign analytics, and reconcile differences that come from cross-device behavior or ad blockers.
If your team maintains an email marketing best practices pdf, update it yearly. Privacy changes, measurement frameworks, and e-commerce analytics evolve quickly. Make sure your 2023, 2024, and email marketing best practices 2025 guidance reflects current tracking realities.
Reporting Cadence and Templates
Adopt a weekly executive summary that fits on a single page.
Show revenue per send, conversion rate, CTR, and CTOR, unsubscribe and bounce rates, and a short narrative on what changed and why.
Include a single recommendation with expected impact and effort.
Run a monthly deep-dive that compares period-over-period and year-over-year performance.
Break down performance by lifecycle flow, campaign type, device, and segment.
Highlight top-performing links, landing pages, and offers, and identify experiments to scale or retire.
Deliver a shareable pack with a PDF snapshot for executives and CSV appendices for analysts.
Ensure every figure can be traced back to a dashboard tile or export.
Make “what’s next” explicit, including the tests you will run and the KPIs you will use to judge success.
Conclusion
Winning teams don’t rely on gut checks or inflated opens. They build tight tracking, align on clear ecommerce KPIs, and use fast, trustworthy dashboards to spot revenue patterns.
The right capabilities make this approach practical, from link-level click analytics and ecommerce revenue attribution to near real-time updates and exportable reports.
Tools like TargetBay Email & SMS help eCommerce brands operationalize these email analytics best practices without adding complexity.
When needed, data from TargetBay Reviews and TargetBay Rewards can enrich segmentation and reveal loyalty-driven revenue that deserves credit.